

Navicat Monitor 3 is a safe, simple and agentless remote server monitoring tool that includes many powerful features to make your monitoring effective as possible. You can access Navicat Monitor from anywhere via a web browser to access statistics on server load and performance regarding its availability, disk usage, network I/O, table locks and more.
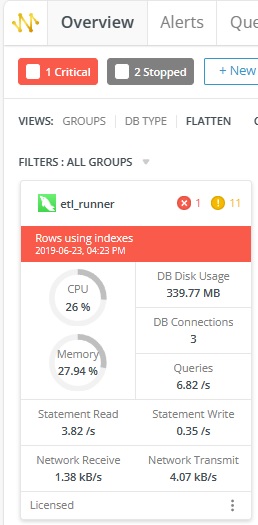
Did you know that you can also collect custom performance metrics for specific instances using your own query, and receive alerts about your custom data when the metric value passes certain thresholds and durations? Custom metrics can even be displayed as charts to help better understand your data and quickly identify trends. In today's blog we'll create a custom metric that shows the average cost of movie rentals in the Sakila Sample Database.
Creating a Custom Metric
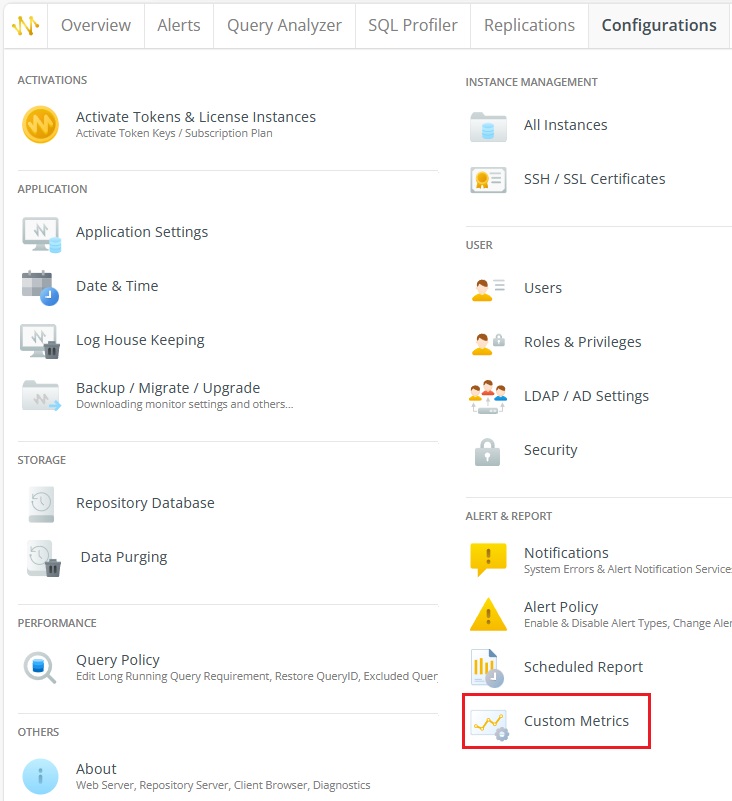
You'll find the Custom Metrics page in the ALERT & REPORT section on the Configurations tab:
- In the Custom Metrics page, click the "+ New Custom Metric" button to bring up the New Custom Metric dialog.
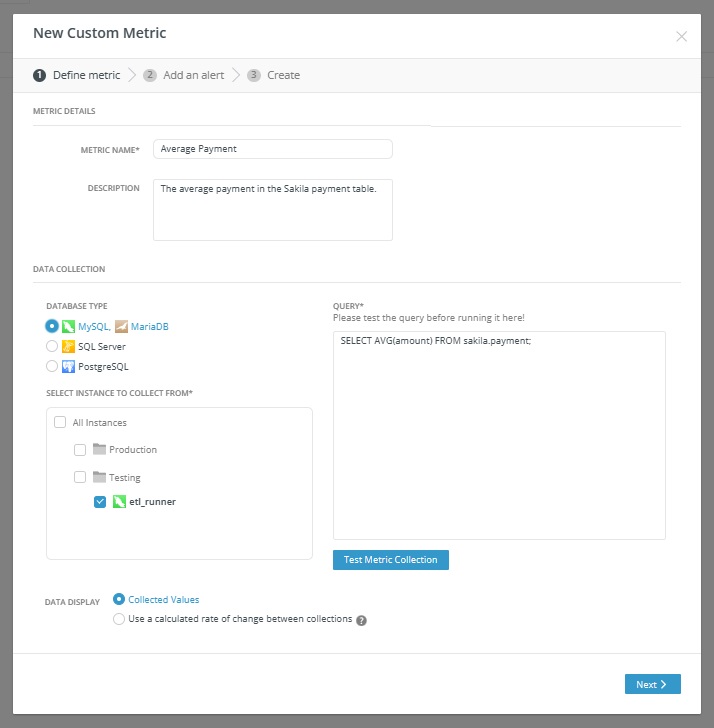
- The first step is to provide the METRIC DETAILS, which include the METRIC NAME and DESCRIPTION. We'll call our metric "Average Payment". (Note that the name cannot include the "<", ">", ":", """, "/", "|", "?", "*" characters or any OS reserved names.) For the DESCRIPTION, let's add "The average payment in the Sakila payment table.".
- For the DATABASE TYPE, we'll select "MySQL".
- We can collected metrics from all instances to one specific database. In our case, we'll select our MySQL instance.
- In the QUERY field, it's important to note that the query must return a single, numeric scalar or NULL value. Therefore, we should, apply an aggregate function to the column of interest, such as AVG, MIN, or MAX. In our case, we'll use the AVG function: "SELECT AVG(amount) FROM sakila.payment;". Be sure to prefix the table with the DB name and then run the query in the Navicat client to make sure that it returns a single value.
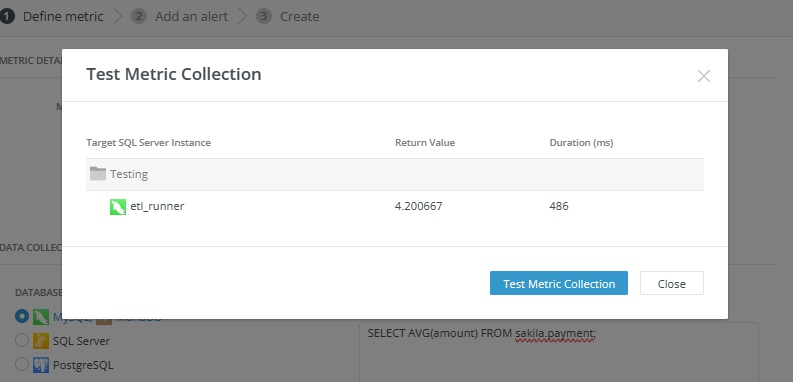
- Now let's click the Test Metric Collection button to verify that data can be successfully collected from selected instances within a reasonable duration. Here's what our query produced:
- For the DATA DISPLAY we can choose to use collected or calculated values. Collected Values are the actual values collected after running the query whereas calculated values use a calculated rate of change between collections, which measure the difference of the metric value divided by the number of seconds between each collection. The latter is useful in situations where new values are collected very frequently. We'll stick with the Collected Values for our metrics.
Here's what we've got so far:
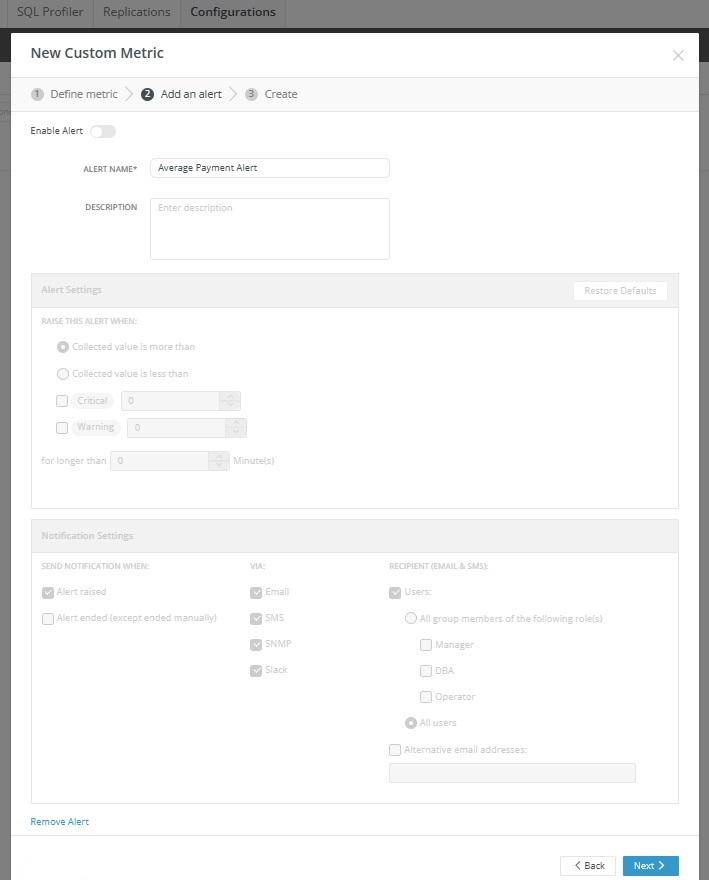
- On the Next screen, we can add an alert for our Custom Metric. We might want to do so if our metric was related to the server's health, but since ours is really only informational, we'll move the Enable Alert slider to the off position. That will grey out the rest of the screen, with the exception of the ALERT NAME field, which is required. We'll call ours "Average Payment Alert":
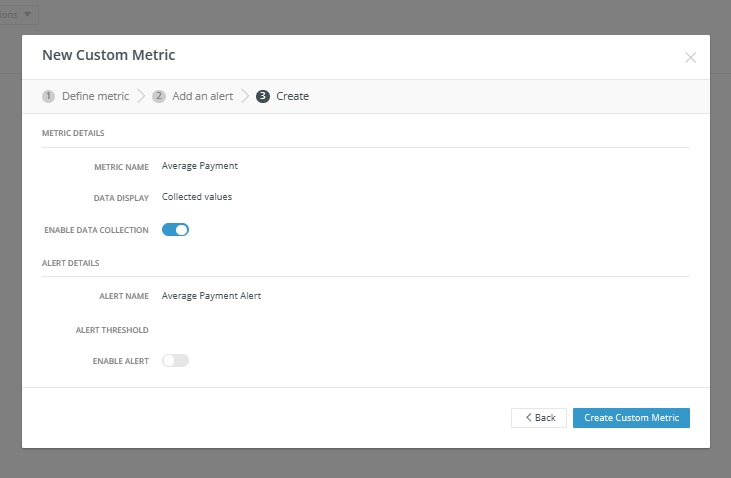
- The next and final screen shows a summary of our new Custom Metric. There, we can ENABLE (or disable) DATA COLLECTION a well as ENABLE (or disable) ALERTs:
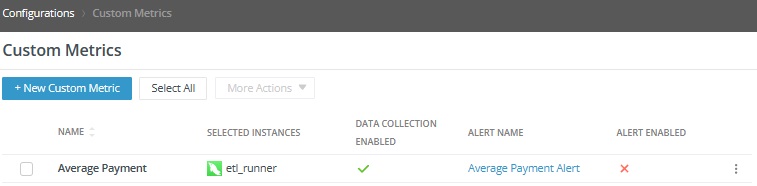
- Clicking the Create Custom Metric button will close the dialog and show our new Custom Metric in the list:
Conclusion
Navicat Monitor 3's Custom Metrics are the perfect tool for tracking data that is meaningful to you and your organization. Moreover, by viewing changes over time in an area or line chart allow you to better spot helpful patterns. Finally, alerts can inform you of potential opportunities or dangers as soon as possible so that you can respond in a timely fashion.


