

Last week's blog heralded the upcoming launch of Navicat 17, which is currently in Beta and scheduled to arrive on May 13 (English Edition)! As we saw, version 17 introduces a lot of exciting new features. One of the biggest is the Data Profiling tool. It provides a visual and comprehensive view of your data at the click of a button! In today's blog, we'll use it to obtain some quick statistics on the rental table of the free PostgreSQL "dvdrental" sample database.
Launching the Data Profiling Tool
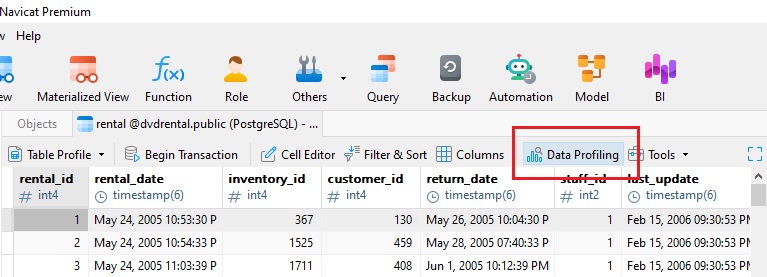
As mentioned in the introduction, the Data Profiling tool requires little more than the click of a button to use. You'll find it in the toolbar of any table, view, or query result (highlighted in red below):
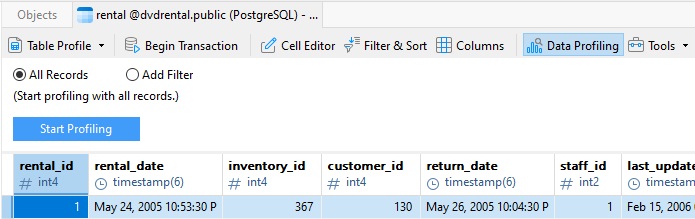
From there, you can choose to profile all records (the default) or add a filter to only profile rows which fit a given criteria:
Filtering Records
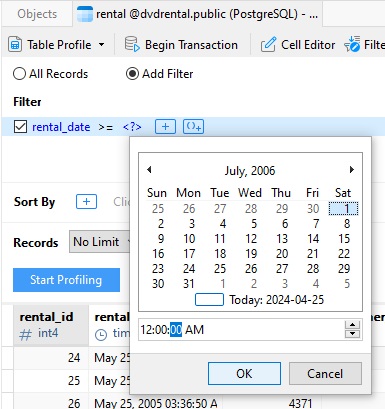
For datasets with many records, it is often useful to focus on a subset of the data. That's where the "Add Filter" option comes in. It allows us to add filters (and sorting) using the familiar "Filter & Sort" feature. Let's say that we only want to profile records of the rental table whose rental date is in the first half of 2006. All we need to do is add a filter on the rental_date column that selects rows with values that are between Jan 1st, 2006 00:00:00AM and June 30th, 2006, at 11:59:59PM. Selecting the dates and times is a snap, thanks to the built-in Date and Time Picker!
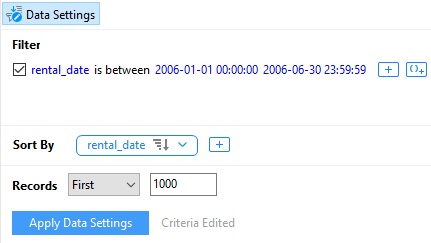
One feature of the Data Profiler that you won't find in the "Filter & Sort" tool is the ability to limit records to a certain number, like say, a thousand:
Viewing Profiling Results
Clicking the "Start Profiling", or ""Apply Data Settings" button after editing the criteria, runs the profiler on the rows which fit the selected filtering criteria.
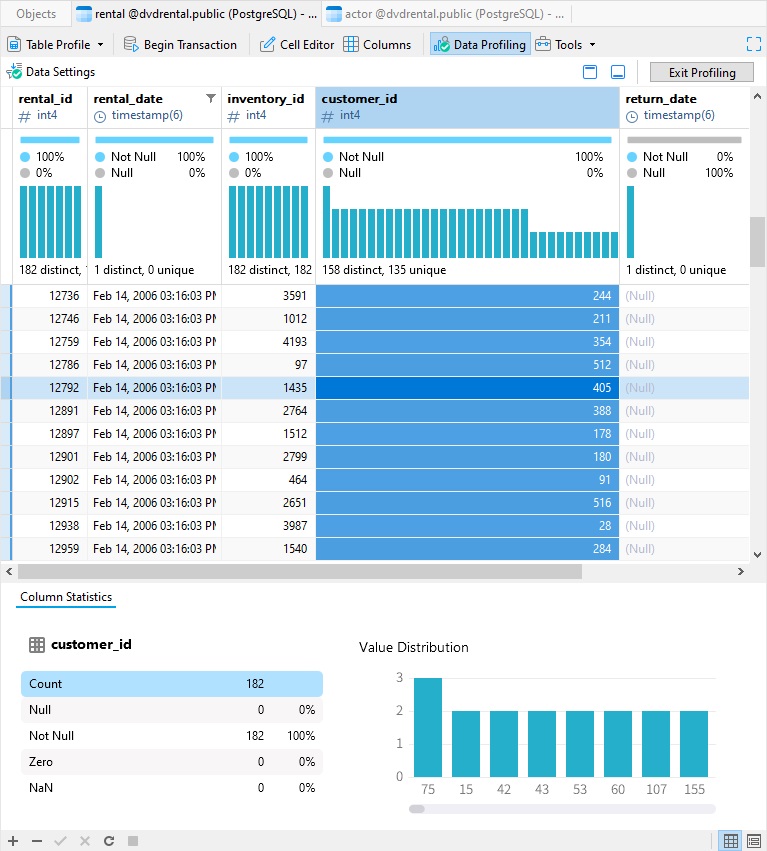
Clicking on the column header shows the statistics for that field. These are shown in 2 places: under the column name and below the grid.
The kinds of stats you'll find include the percentage of Nulls vs. Non-nulls, as well as the number of distinct and unique values. There's even a value distribution chart! To view all of the values, you can either increase the column width or simply use the scrollbar at the bottom of the Value Distribution chart in the Column Statistics at the bottom of the screen:
Changing the Layout
There are a few options for changing how the data is presented. For instance, we can show distributions by count or value:
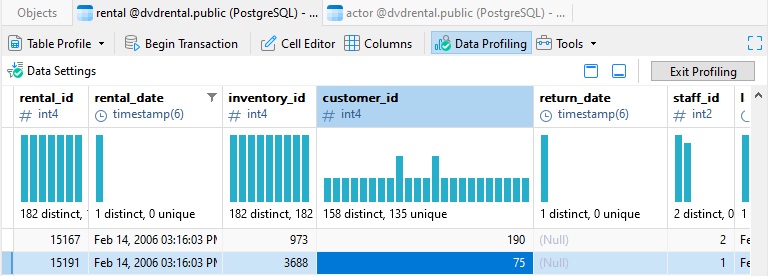
We can also choose between a Compact or Detailed layout (Detailed is the default). Here are the rental table headers with the Compact layout:
Getting More Specific
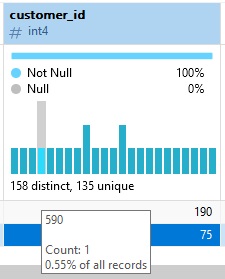
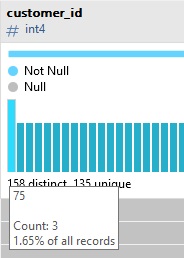
Every bar of the distribution chart represents a real record in the underlying table, view, or query. We can learn more about it by hovering the cursor over it. The popup box shows the value, along with how many times it appears within the dataset and what percentage that represents across all of the records:
Moreover, clicking a bar will Spotlight that record, which will home in on that row in the grid and display statistics which are pertinent to that value:
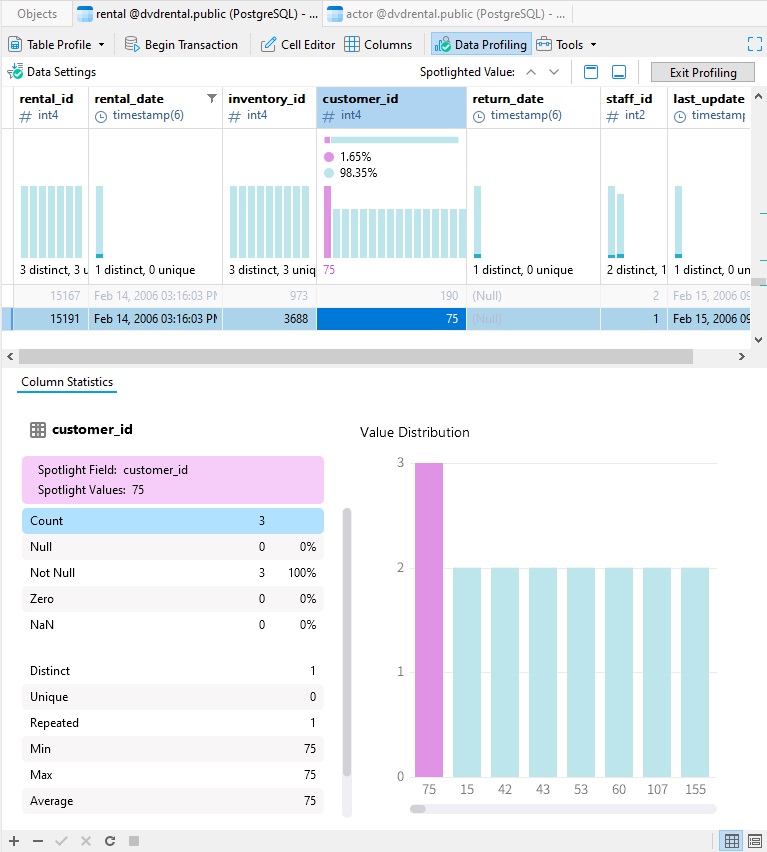
Clicking the bar a second time will remove the Spotlight.
We can also see in the above image the full range of stats available in the Column Statistics section. It includes additional figures, such as the number of Repeated values, Minimum and Maximum values, and many more.
Conclusion
In today's blog, we familiarized ourselves with Navicat 17's new Data Profiling tool by using it to obtain some quick statistics on the free "dvdrental" sample database's rental table.
On May 13, be sure to visit the Navicat Premium (English Edition) product page to learn more about version 17!


