

It's a well established practice in database design and development to avoid storing any data that can be calculated or reconstructed from other fields. As a result, you may be missing some data when constructing your charts in Navicat BI. But that's not an issue, as Navicat BI provides Calculated Fields specifically for that purpose. In today's blog, we'll be using Calculated Fields to build a chart that shows the average rental times - i.e., how long a customer keeps a movie before returning it - per customer. As with most of the articles in this series, the data will be curated from the free "dvdrental" sample database.
Fetching the Customer Rental Information
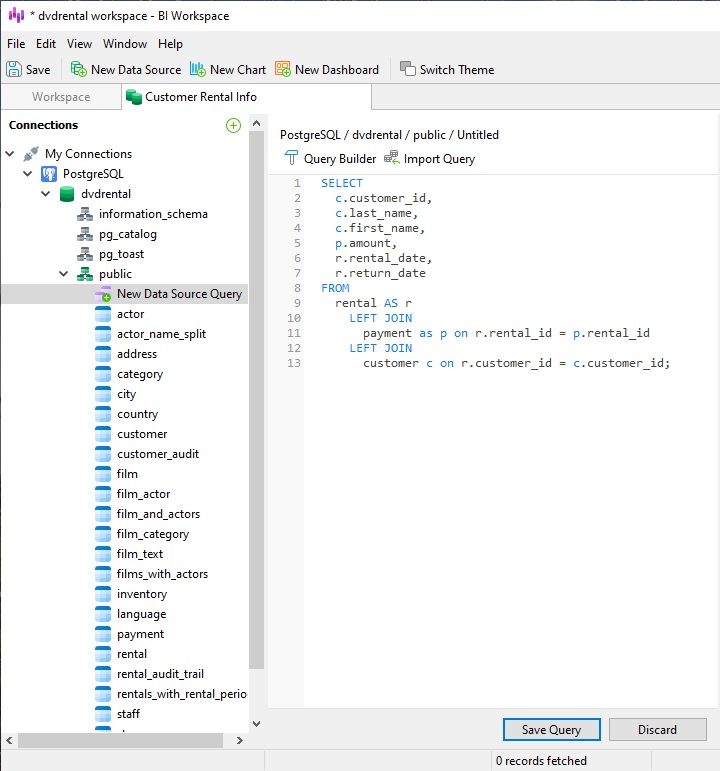
As mentioned in previous blogs in this series, we should create the data source before designing the chart as we will need to specify the data source that the chart uses. Data sources reference tables in your connections or data in files/ODBC sources, and can select data from tables on different server types. After creating a new data source, we can click on "New Data Source Query" to open the Query Designer. There, we can write our SQL statement directly in the editor, use the visual Query Builder, or import a query from Navicat. Here's the SELECT statement that will fetch customer info, along with the rental amount, the date that the film was rented, and the date on which it was returned:
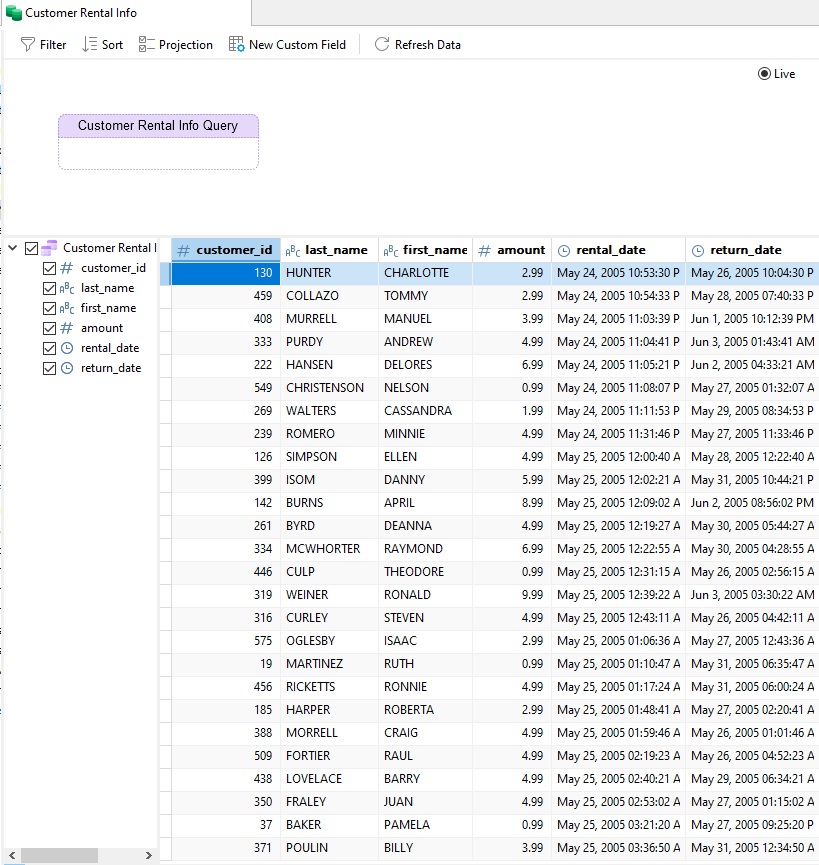
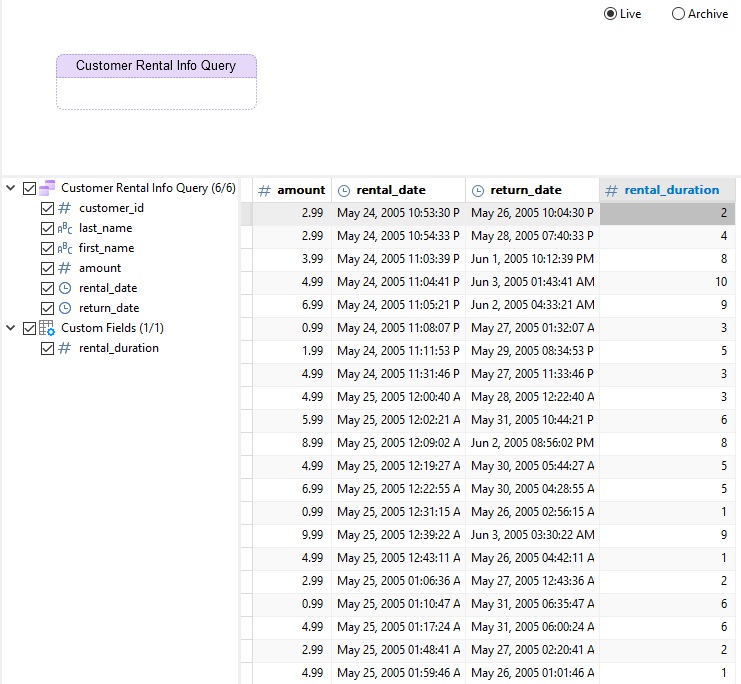
Once we save the query and refresh the data, we should see all the the query fields and result set:
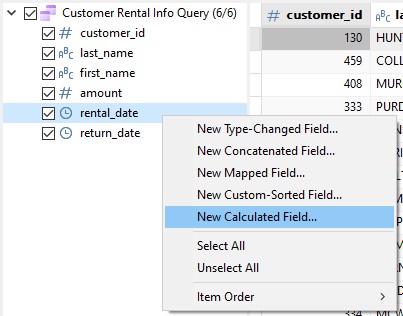
We can now use the rental_date and return_date fields to calculate the rental duration. To do that, right-click the return_date in the field list (Control-click on macOS) and select New Calculated Field... from the context menu:
In the New Calculated Field dialog, you'll find all sorts of useful functions, including Aggregate functions, Datetime functions, Logic functions, and others. We'll use the DATEDIFF() function to calculate the number of days between the rental_date and return_date fields. The function accepts a time Unit, as well as a Start and End date. We can read the description below the function list for more information. We'll pass a "D" (day) for the unit, along with the two date fields, as follows:
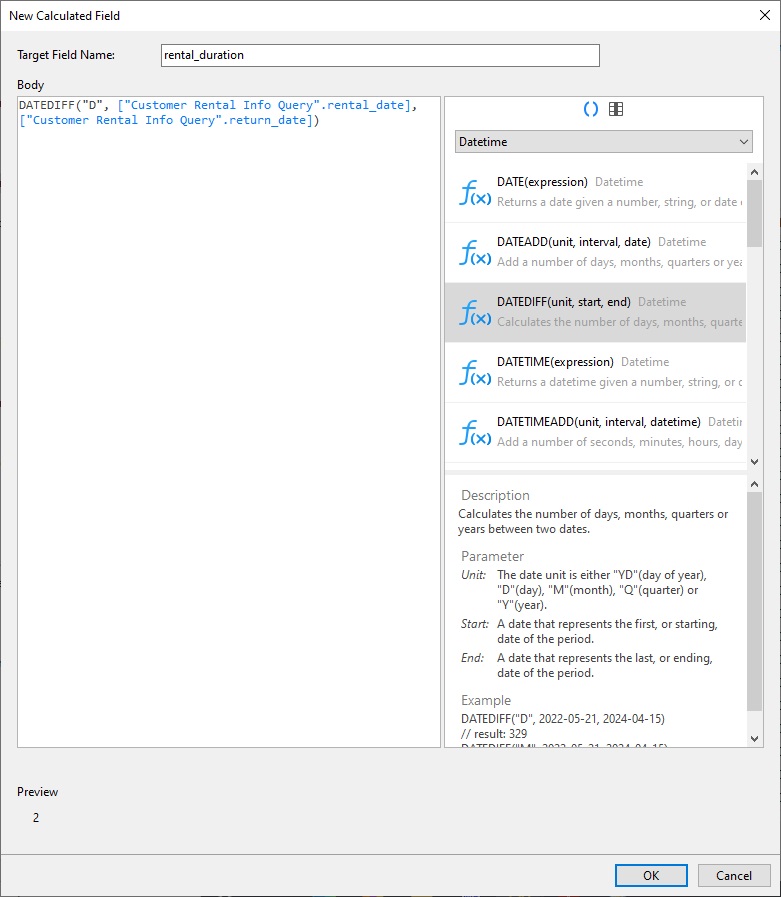
There's a preview at the bottom of the dialog that tells us that we're getting the result we want.
After clicking the OK button, we should see our new field in the field list and results:
Building the Average Rental Duration Per Customer Chart
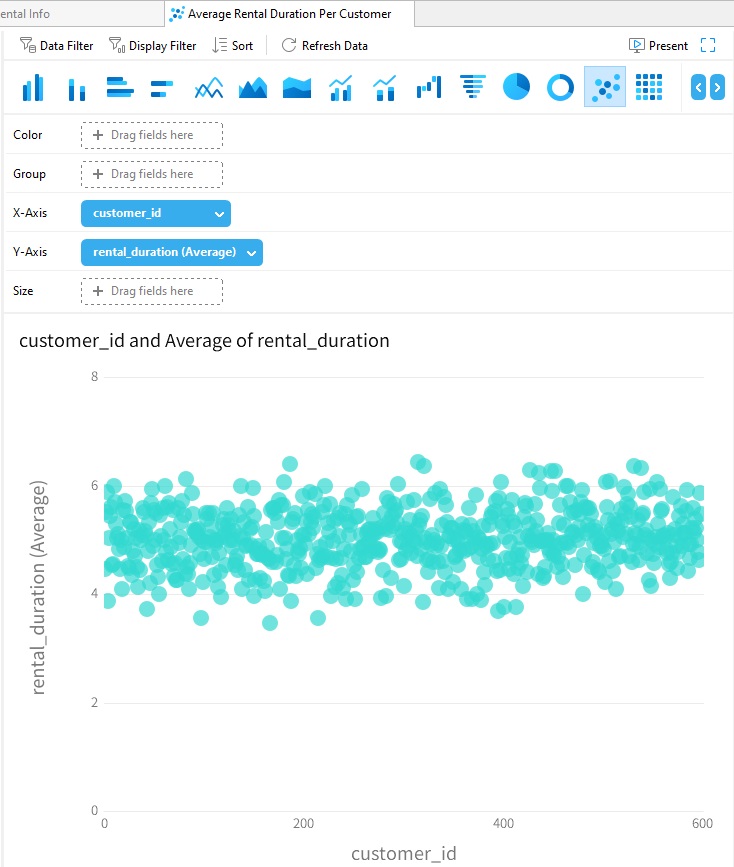
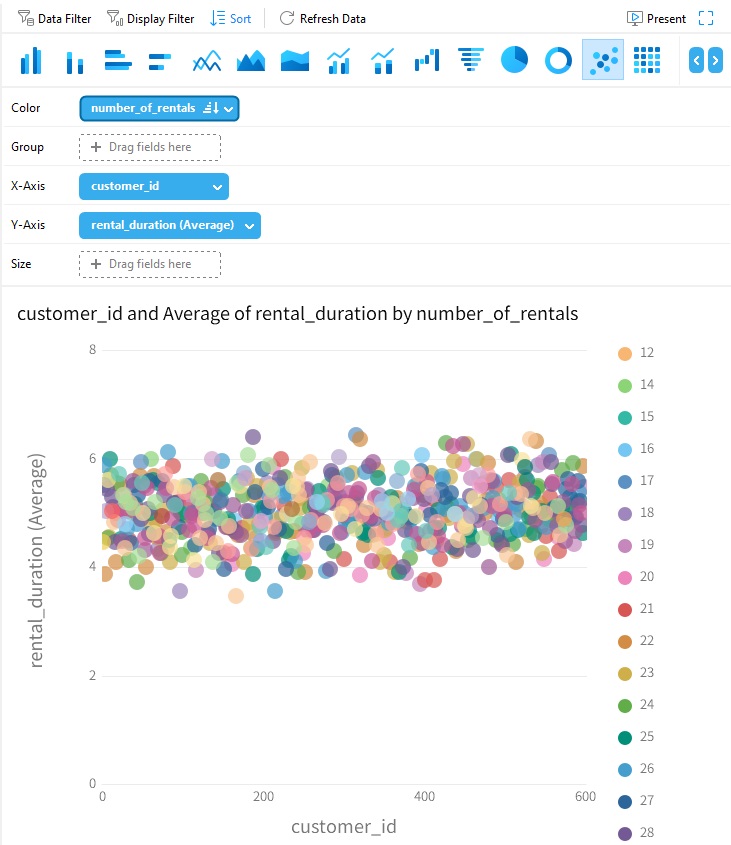
Since every customer ID is a separate data point, a scatter chart might work well. A scatter chart plots data with individual data points placed along the X and Y axes. We'll use the customer_id for the X axis and the rental_duration (Average) for the Y axis. Just drag the fields over to the X-Axis and Y-Axis fields in the chart designer, apply the Average aggregate to the rental_duration, and, presto, instant chart!
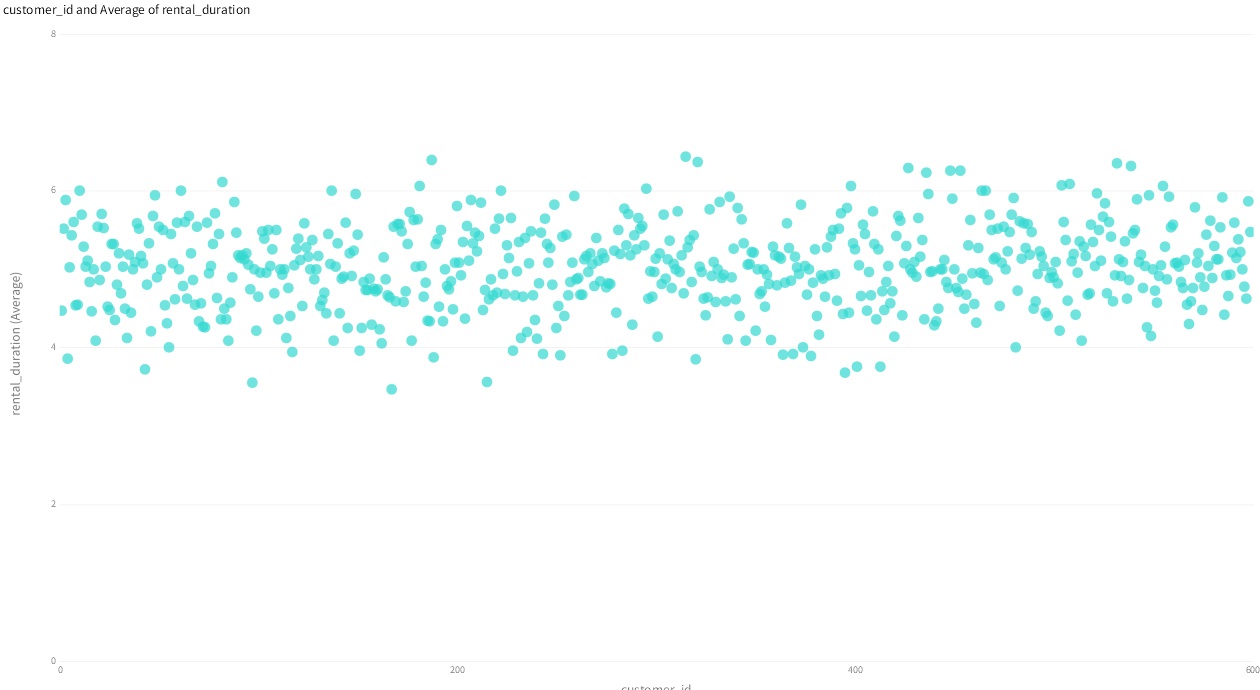
Here is the full chart in Present mode:
Bonus: Displaying the Number of Rentals Per Customer
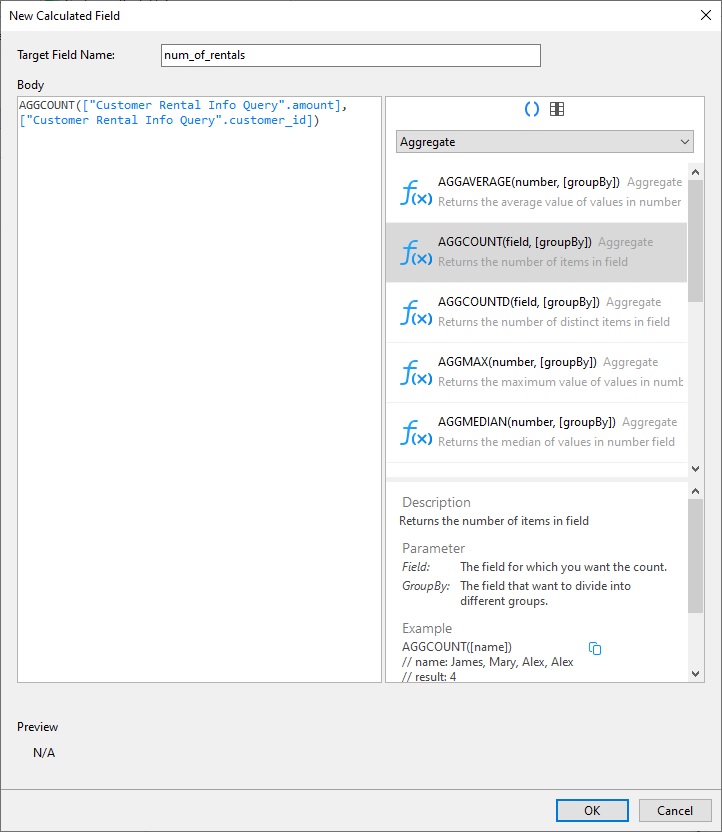
While averages are helpful, it might also be useful to show how many times each customer rented one or more films. We can use an Aggregate function for this purpose. We'll count the number of amount entries in the result set and group them by customer_id. Here is the New Calculated Field dialog with the call to the AGGCOUNT() function:
In the Chart Designer, we'll drag our new number_of_rentals field to the Color slot. Adding an ascending sort will order the legend items from the lowest to highest number of rentals:
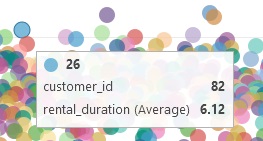
We can view the details of and individual data point by hovering the cursor over it. A tooltip will appear showing the number of rentals, the customer_id, as well as the average rental_duration in days:
Conclusion
This blog covered how to use Calculated Fields in your Navicat BI data sources and charts. These were just one of the new features included with the latest version of Business Insight (BI). This also brings us to the end of this series on Custom Fields. If you'd like to try Navicat BI, you can download the stand-alone version for a 14-day fully functional FREE trial. It's available for Windows, macOS, and Linux operating systems.


